

Image Details
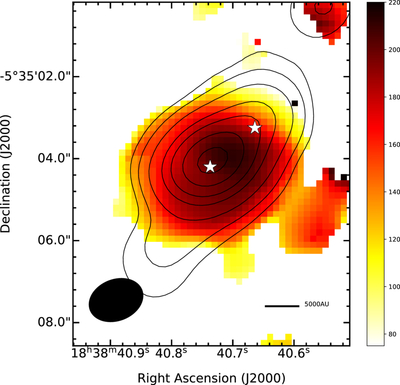
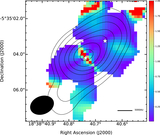
Caption: Figure 9.
The rotation temperature map for CH3OH. Only the locations with significant measurements in integrated flux (above 3σ) in all of the involved transitions are included in the map. The continuum contours adopt the same levels as Figure 1(b) but begin at 12σ.
Other Images in This Article
Copyright and Terms & Conditions
© 2026. The Author(s). Published by the American Astronomical Society.

Copyright ©
2026 Astronomy Image Explorer. All Rights Reserved.
