

Image Details
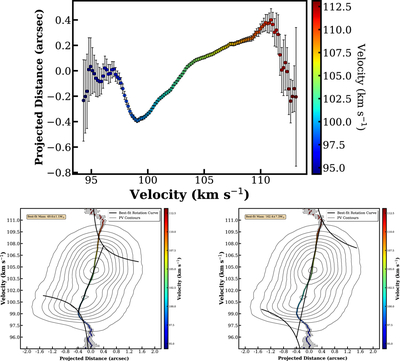
Caption: Figure 6.
Top panel: rotation curves for CH3OH(102,9–93,9) in IRAS 18360. The projected distance is calculated as the distance from the velocity centroid point to the best-fitted line passing through the maximum flux position of this transition. Bottom panel: the left and right plots show the best fits to the rotation curves for the blueshifted lobe (below 103 km s−1) and the redshifted lobe (above 104 km s−1), respectively. The best-fit enclosed masses are 49.6 ± 1.1M⊙ for the blue lobe and 162.4 ± 7.3 M⊙ for the red lobe. The black lines represent the resulting fits for each lobe. The contours show the position–velocity diagram along the position angle of 127°. The contour levels begin at 3σ (60 mJy beam−1) and increase to a maximum value of 2.33 Jy beam−1 in 10 linearly spaced levels.
Other Images in This Article
Copyright and Terms & Conditions
© 2026. The Author(s). Published by the American Astronomical Society.

