

Image Details
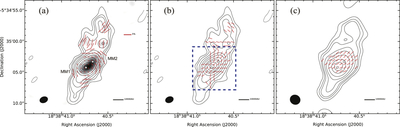
Caption: Figure 1.
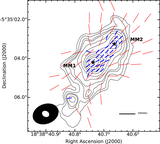
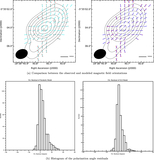
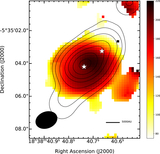
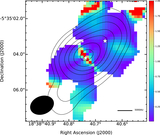
(a) ALMA 1.3 mm dust continuum contours toward IRAS 18360 overlaid polarization intensity maps (grayscale) and polarization orientations at lower resolution (∼1﹩\mathop{.}\limits^{\unicode{x02033}}﹩2). The contour levels are −2, 3, 5, 7, 12, 20, 40, 90, 150, 260, and 410 times the σ value of 1.3 mJy beam−1. The polarization segments (drawn following the Nyquist sampling) are plotted above the 3σ level (σ = 95 μJy beam−1), with segment lengths proportional to polarization fraction (5% reference at the top right). Stars mark the position of dust condensations MM1 and MM2 (K. Qiu et al. 2012). (b) Contours and stars as in (a), but segments show magnetic field orientation (rotating the polarization segments by 90°). The blue rectangle represents the same region shown in Figure 2. (c) The 1.3 dust continuum contours and magnetic field segments observed by 1.3 mm SMA polarization observations (Q. Zhang et al. 2014). The contour levels are 3, 5, 7, 12, 20, 40, 90, 150 × σ = 7.5 mJy beam−1. The synthesized beam size and scale bar are shown at the bottom of each panel.
Other Images in This Article
Copyright and Terms & Conditions
© 2026. The Author(s). Published by the American Astronomical Society.

