

Image Details
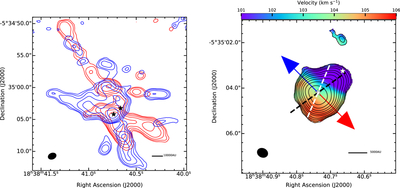
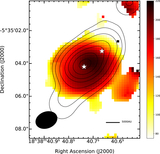
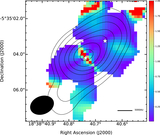
Caption: Figure 3.
(a) The SiO (J = 5-4) emission observed with the ALMA and integrated from 85.8 to 100.6 km s−1 for the blueshifted lobe and from 106.0 to 120.8 km s−1 for the redshifted lobe, shown in blue and red contours, respectively. The contour levels of SiO emission are 3, 5, 9, 17, 33, 65, 129, 257 times σ = 36 mJy beam−1 km s−1. (b) The color image shows the first-moment map of the CH3OH (102,9−93,9) emission, and the contours correspond to the zeroth moment contour map. The contour levels are 3, 5, 9, 17, 33, 65, 129, 257, 513 times σ = 8 mJy beam−1 km s−1. The black dotted line represents the velocity gradient of the CH3OH map, and white dotted lines are the gradient identified in G. Wu et al. (2023). The blue and red arrows represent the bipolar outflow axis.
Other Images in This Article
Copyright and Terms & Conditions
© 2026. The Author(s). Published by the American Astronomical Society.

