

Image Details
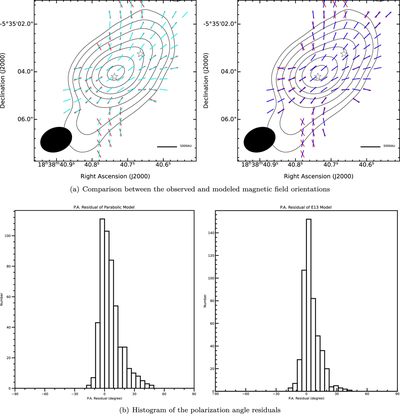
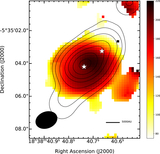
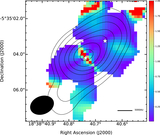
Caption: Figure 7.
Top panel: contour map of the total (Stokes I) dust emission and the magnetic field vectors (the black contours are the same as Figure 9) with the best family of functions shown as B-vectors (cyan bars: parabolic model; blue bars: Ewertowski model) at the same position as the measured values. Bottom panel: position angle (P.A.) distribution of the polarization vectors for the best-fit parabolic model and Ewertowski model.
Other Images in This Article
Copyright and Terms & Conditions
© 2026. The Author(s). Published by the American Astronomical Society.

Copyright ©
2026 Astronomy Image Explorer. All Rights Reserved.
