

Image Details
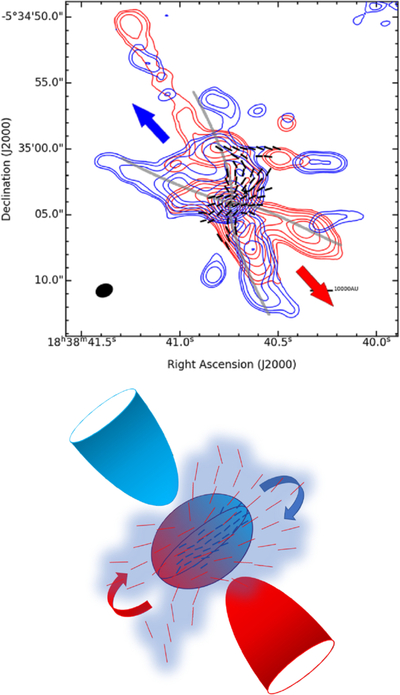
Caption: Figure 4.
Upper panel: the magnetic field lines (black segments) overplotted on the SiO (J = 5–4) emissions (colored contours). The red and blue contours are the same as Figure 3(a). The gray curves outline the bipolar outflow, and the red and blue arrows indicate the orientation of the outflow axis. The observed magnetic lines, situated away from the central region, are consistent with the cavity of outflows, suggesting that the magnetic field is influenced by outflows. Lower panel: this schematic presents a potential explanation for the morphology of the magnetic field. The envelope scale field lines are dragged into a spiral configuration by the strong gas rotations.
Other Images in This Article
Copyright and Terms & Conditions
© 2026. The Author(s). Published by the American Astronomical Society.

