

Image Details
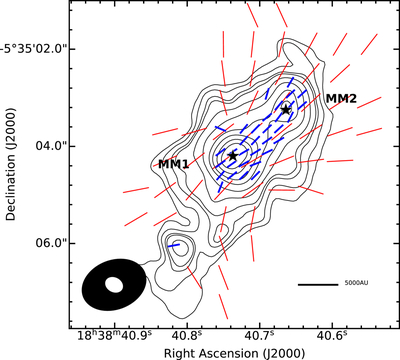
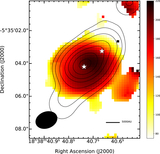
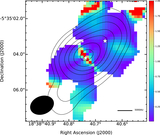
Caption: Figure 2.
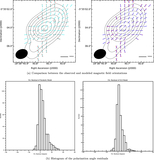
Zoomed-in view of the blue rectangle area in Figure 1. Contours show higher-resolution (∼0﹩\mathop{.}\limits^{\unicode{x02033}}﹩35) dust continuum emission in steps of 5, 7, 12, 20, 40, 90, 150, 260, and 410 times the σ value of 350 μJy beam−1. Blue segments represent the magnetic field orientation observed in higher resolution. Red magnetic segments are replicated from Figure 1(b).
Other Images in This Article
Copyright and Terms & Conditions
© 2026. The Author(s). Published by the American Astronomical Society.

Copyright ©
2026 Astronomy Image Explorer. All Rights Reserved.
