

Image Details
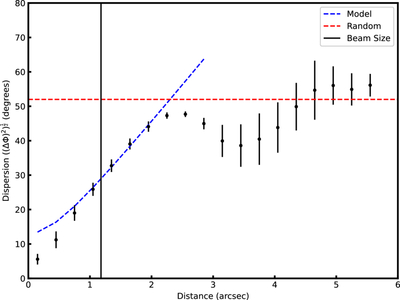
Caption: Figure 8.
Structure function for a center region of IRAS 18360. The measured angle dispersion is shown in black solid circles with the error bars. The best is shown by the blue dashed line. The vertical dashed line represents the beam size of the observations ∼1﹩\mathop{.}\limits^{\unicode{x02033}}﹩1 and the horizontal red dashed line is the predicted angle dispersion for a random field ∼52°.
Other Images in This Article
Copyright and Terms & Conditions
© 2026. The Author(s). Published by the American Astronomical Society.

Copyright ©
2026 Astronomy Image Explorer. All Rights Reserved.
