Image Details
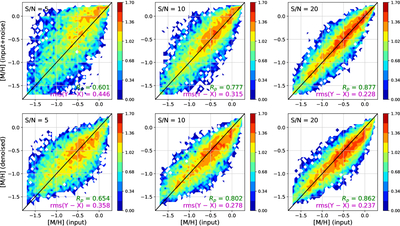
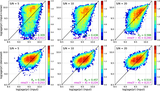
Caption: Figure 8.
Same as Figure 7, but for mass-weighted global metallicity, [M/H]. Each panel compares the input metallicity (x-axis) with the value recovered by PPXF (y-axis) from the noisy (top row) and denoised (bottom row) spectra. Colors show the logarithmic number density, and the diagonal line indicates the one-to-one relation. Columns correspond to S/N = 5, 10, and 20 (left to right). Each panel reports the Pearson correlation coefficient, Rp, and the rms difference, rms(Y − X), in dex.
Other Images in This Article
Copyright and Terms & Conditions
© 2026. The Author(s). Published by the American Astronomical Society.
Copyright ©
2026 Astronomy Image Explorer. All Rights Reserved.