Image Details
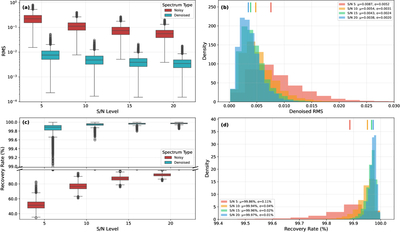
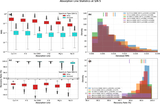
Caption: Figure 4.
Full-spectrum denoising statistics for 10,000 synthetic test spectra at input S/N = 5, 10, 15, and 20. (a) Box-and-whisker plots of per-spectrum RMS residuals relative to the corresponding noise-free spectra, comparing noisy inputs (red) and EUT-denoised outputs (cyan). (b) Distributions of RMS residuals for the denoised outputs; vertical ticks mark medians, and the legend lists the mean (μ) and standard deviation (σ) at each S/N. (c) Recovery rate, defined as the Pearson correlation coefficient between the noise-free and comparison spectra (Equation (5)) and expressed as a percentage; the y-axis is broken to emphasize the denoised results. (d) Distributions of recovery rates for the denoised outputs; the legend lists μ and σ. In panels (a) and (c), the box spans the interquartile range (IQR), the horizontal line marks the median, whiskers extend to 1.5 × IQR, and black open circles indicate outliers.
Other Images in This Article
Copyright and Terms & Conditions
© 2026. The Author(s). Published by the American Astronomical Society.