Image Details
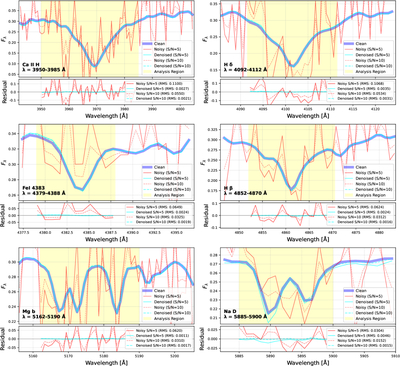
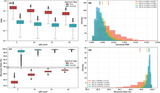
Caption: Figure 5.
Example of absorption-line recovery at input S/N = 5 and 10. Columns correspond to six diagnostic features: Ca II H, Hδ, Fe I 4383, Hβ, Mg b, and Na D. In each column, the upper panel overlays the noise-free spectrum (blue), the noisy inputs (red), and the denoised outputs (cyan). Solid lines represent S/N = 5, while dashed lines represent S/N = 10. The shaded regions mark the fixed wavelength windows used for quantitative analysis. The lower panel shows the residuals relative to the noise-free spectrum; the legend reports the RMS residual within the analysis window.
Other Images in This Article
Copyright and Terms & Conditions
© 2026. The Author(s). Published by the American Astronomical Society.
Copyright ©
2026 Astronomy Image Explorer. All Rights Reserved.