Image Details
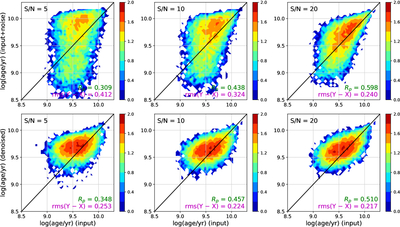
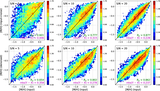
Caption: Figure 7.
Recovery of mass-weighted age from noisy and EUT-denoised spectra. Each panel compares the input age [﹩\mathrm{log}({\rm{age}}/{\rm{yr}})﹩; x-axis] with the value recovered by PPXF (y-axis) for 104 synthetic spectra. Colors show the logarithmic number density, and the black line indicates the one-to-one relation. The top row shows results for the noisy spectra, and the bottom row shows results for the corresponding denoised spectra. Columns correspond to S/N = 5, 10, and 20 (left to right). Each panel reports the Pearson correlation coefficient, Rp, and the rms difference, rms(Y − X), in dex. Denoising reduces the scatter around the one-to-one relation, particularly at S/N ≤ 10.
Other Images in This Article
Copyright and Terms & Conditions
© 2026. The Author(s). Published by the American Astronomical Society.