Image Details
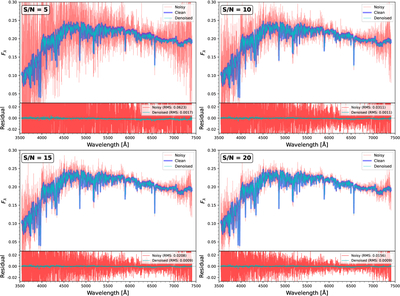
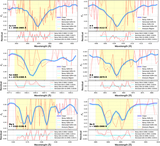
Caption: Figure 3.
Example of full-spectrum denoising results for a representative synthetic spectrum at four input signal-to-noise ratios (S/N = 5, 10, 15, and 20). In each panel, the top plot displays the noise-free reference (blue), the noisy input (red), and the EUT-denoised output (cyan). The bottom plot shows the residuals relative to the noise-free spectrum for both the noisy input (red) and the denoised output (cyan). The legend indicates the rms residual for each case.
Other Images in This Article
Copyright and Terms & Conditions
© 2026. The Author(s). Published by the American Astronomical Society.
Copyright ©
2026 Astronomy Image Explorer. All Rights Reserved.