Image Details
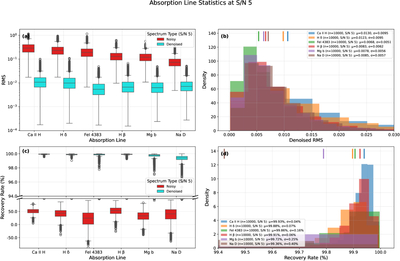
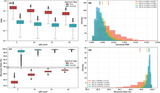
Caption: Figure 6.
Absorption-line denoising statistics at input S/N = 5 for six diagnostic features (Ca II H, Hδ, Fe I 4383, Hβ, Mg b, and Na D). Measurements use the fixed wavelength windows highlighted in Figure 5 for 10,000 synthetic test spectra. (a) Box-and-whisker plots of RMS residuals (relative to the noise-free spectra) within each window for noisy inputs (red) and denoised outputs (cyan), shown on a logarithmic scale. (b) Distributions of the denoised RMS residuals; vertical ticks mark medians, and the legend lists the mean (μ) and standard deviation (σ) for each feature. (c) Recovery rate within each window (Pearson correlation coefficient; Equation (5)), with a broken y-axis for clarity. (d) Distributions of the denoised recovery rates; the legend lists μ and σ (in percent). Boxplot conventions (including black open-circle outliers) follow Figure 4.
Other Images in This Article
Copyright and Terms & Conditions
© 2026. The Author(s). Published by the American Astronomical Society.