Image Details
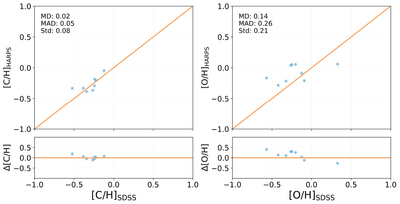
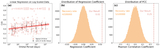
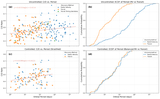
Caption: Figure 11.
Comparison of stellar abundances between HARPS and SDSS. Top: direct comparison of [C/H] (left) and [O/H] (right). The orange line indicates the 1:1 relation. Bottom: residuals relative to the 1:1 line. Inset statistics denote the MD, median absolute deviation (MAD), and Std.
Other Images in This Article
Show More
Copyright and Terms & Conditions
© 2026. The Author(s). Published by the American Astronomical Society.
Copyright ©
2026 Astronomy Image Explorer. All Rights Reserved.