Image Details
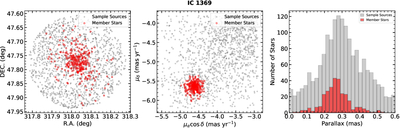
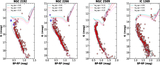
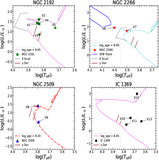
Caption: Figure 3.
Spatial, kinematic, and parallax distributions of the stars in the field of IC 1369. The gray points represent all sources within the adopted search radius, while the red points denote the stars identified as cluster members. The panels illustrate (left) the spatial concentration of members, (middle) their tight grouping in proper-motion space, and (right) the parallax histogram, which shows a distinct peak corresponding to the cluster. This figure shows IC 1369 as a representative example of the procedure applied to all four clusters analyzed in this study.
Other Images in This Article
Show More
Copyright and Terms & Conditions
© 2026. The Author(s). Published by the American Astronomical Society.
Copyright ©
2026 Astronomy Image Explorer. All Rights Reserved.