Image Details
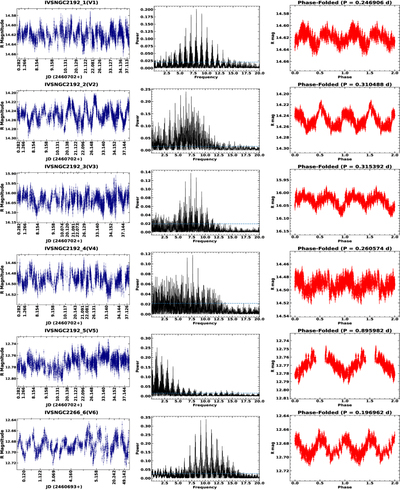
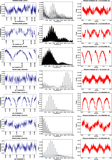
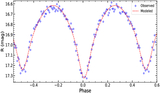
Caption: Figure 6.
Time-series photometric analysis of the newly identified variable stars V1–V6 in the observed OCs. Left panels: original R-band light curves plotted as magnitude versus time (shown as JD − JD0 for clarity). Middle panels: Lomb–Scargle periodograms computed from the calibrated light curves, with the dominant frequency (day−1) peaks corresponding to the adopted variability periods. Periods and amplitudes derived from these light curves are listed in Table 3. The dashed horizontal line in the periodogram denotes the 1% false alarm probability level computed analytically, indicating a highly significant periodic signal. Right panels: phase-folded R-band light curves using the best-fit periods indicated in each panel. The phase-folded curves are shown over two consecutive cycles to emphasize the periodic nature and stability of the variability. The coherent light-curve morphologies and statistically significant periodogram peaks support the classification of these sources as pulsating and rotational variables. In all panels, magnitudes are plotted such that brighter values appear toward the top.
Other Images in This Article
Show More
Copyright and Terms & Conditions
© 2026. The Author(s). Published by the American Astronomical Society.