Image Details
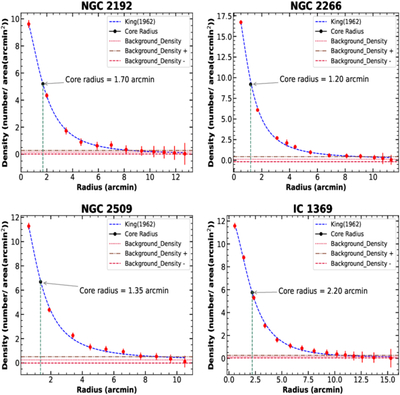
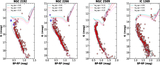
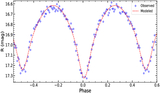
Caption: Figure 4.
Radial density profiles for the OCs NGC 2192, NGC 2266, NGC 2509, and IC 1369. The red points with error bars represent the observed stellar density distribution, while the blue dashed curves show the best-fitting three-parameter King (1962) model. The horizontal dashed lines denote the background density of field stars, and the vertical dashed lines mark the core radii. The derived core radii are 1﹩\mathop{.}\limits^{{\rm{^{\prime} }}}﹩70 for NGC 2192, 1﹩\mathop{.}\limits^{{\rm{^{\prime} }}}﹩0 for NGC 2266, 1﹩\mathop{.}\limits^{{\rm{^{\prime} }}}﹩35 for NGC 2509, and 2﹩\mathop{.}\limits^{{\rm{^{\prime} }}}﹩22 for IC 1369.
Other Images in This Article
Show More
Copyright and Terms & Conditions
© 2026. The Author(s). Published by the American Astronomical Society.