Image Details
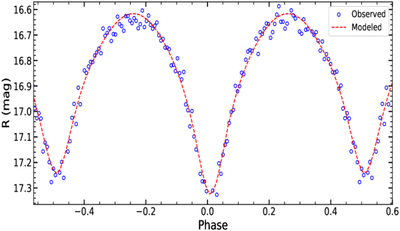
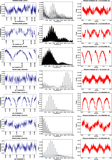
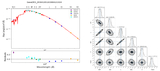
Caption: Figure 10.
Observed (blue points) and PHOEBE-modeled (red curve) R-band light curve of the eclipsing binary IC 1369 plotted as a function of orbital phase. The solid curve shows the best-fitting model from PHOEBE 1.0, demonstrating excellent agreement between the observed data and the synthetic light curve.
Other Images in This Article
Show More
Copyright and Terms & Conditions
© 2026. The Author(s). Published by the American Astronomical Society.
Copyright ©
2026 Astronomy Image Explorer. All Rights Reserved.