Image Details
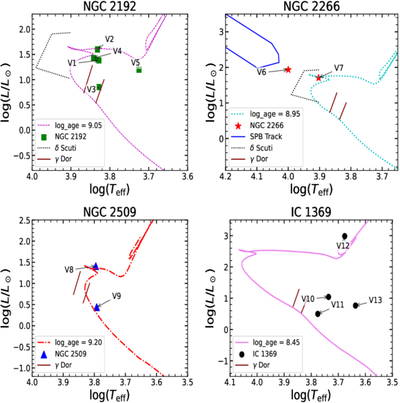
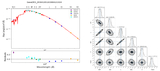
Caption: Figure 9.
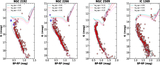
Hertzsprung–Russell diagrams showing the locations of the identified variable stars in the cluster field. The filled symbols correspond to the classified variables, with their positions determined from the derived effective temperatures and luminosities. The plotted evolutionary tracks and isochrones correspond to different ages and evolutionary models, including pre-main-sequence, post-main-sequence, and instability-strip boundaries, as indicated in the legend. The instability regions for δ Scuti, γ Dor, and slowly pulsating B-type (SPB) variables are also shown for reference. The distribution of the variables across these regions helps constrain their evolutionary stages and potential pulsational nature.
Other Images in This Article
Show More
Copyright and Terms & Conditions
© 2026. The Author(s). Published by the American Astronomical Society.