Image Details
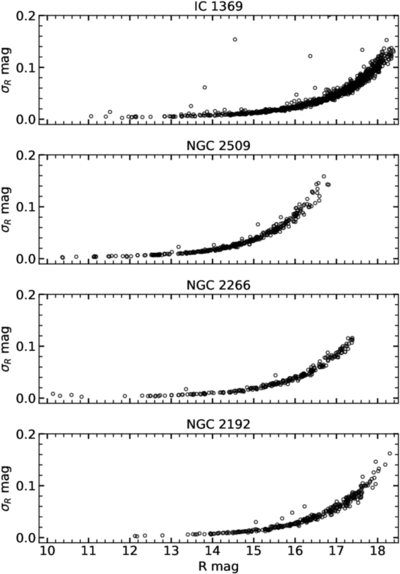
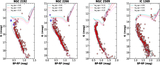
Caption: Figure 2.
Mean photometric uncertainties as a function of stellar brightness in the R band for the clusters under study. Each panel shows the variation of photometric error with R-band magnitude. The plots indicate that the uncertainty remains below ∼0.01 mag for the brighter stars and gradually increases up to ∼0.15–0.20 mag toward the fainter end. The magnitude distribution for NGC 2509 appears truncated at the faint end compared to the other clusters. This effect arises from differences in observing conditions and the shorter total integration time for this cluster, which limits the detection of faint sources.
Other Images in This Article
Show More
Copyright and Terms & Conditions
© 2026. The Author(s). Published by the American Astronomical Society.