Image Details
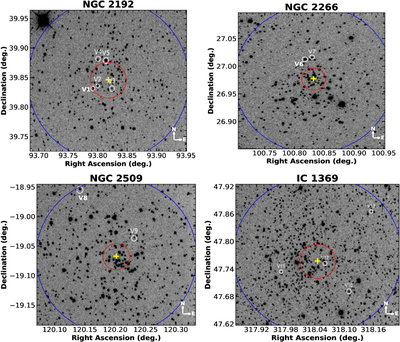
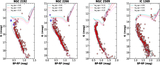
Caption: Figure 1.
R-band finding charts of the observed fields for the OCs NGC 2192, NGC 2266, NGC 2509, and IC 1369. The images are representative frames from the time-series photometric observations used in this study. Newly identified variable stars are marked with white circles and labeled by their IDs. Yellow plus symbols indicate the cluster centers. The inner red circle denotes the cluster core radius, while the outer blue circle indicates the cluster (limiting) radius, both estimated in the present analysis. The orientation is north up and east to the left, with R.A. and decl. shown in degrees.
Other Images in This Article
Show More
Copyright and Terms & Conditions
© 2026. The Author(s). Published by the American Astronomical Society.
Copyright ©
2026 Astronomy Image Explorer. All Rights Reserved.