Image Details
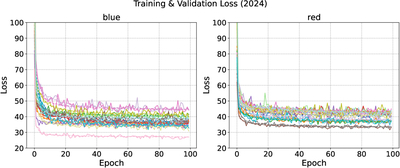
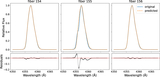
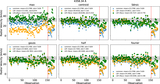
Caption: Figure 3.
One example of the training and validation loss curves in the year of 2024. Colors of the lines indicate the 16 spectrographs of LAMOST, and “blue” and “red” mean the corresponding bands. Solid lines represent the training loss, while dashed lines of the same color correspond to the validation loss.
Other Images in This Article
Copyright and Terms & Conditions
© 2026. The Author(s). Published by the American Astronomical Society.
Copyright ©
2026 Astronomy Image Explorer. All Rights Reserved.