Image Details
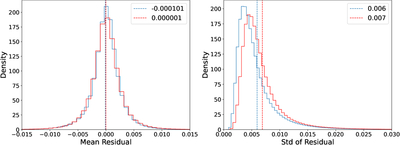
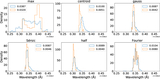
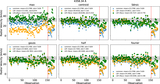
Caption: Figure 4.
The left and right panels show the distributions of ﹩{{\rm{mean}}}_{{\rm{res}}}﹩ and ﹩{\sigma }_{{\rm{res}}}﹩ for all samples, respectively. The color of the lines indicates the spectral band, and the dashed lines represent the mean value.
Other Images in This Article
Copyright and Terms & Conditions
© 2026. The Author(s). Published by the American Astronomical Society.
Copyright ©
2026 Astronomy Image Explorer. All Rights Reserved.