Image Details
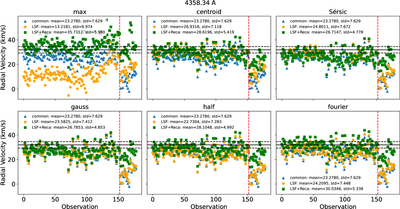
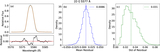
Caption: Figure 9.
RV results for a spectral segment centered at 4358.34 Å. Each point represents the RV computed for one exposure, plotted in chronological order. The blue triangles indicate RVs computed using a commonly adopted Gaussian profile, the orange circles represent results derived using our measured IPs, and the green squares show results using our IPs after recalibrating the wavelength solution. The titles clarify the central wavelength of the used IPs and how they were centered. The numbers in the legend indicate the mean and standard deviation of the velocity measurements. The black solid and dashed lines denote the Gaia RV and its associated error from Table 1, respectively. Since these spectra were taken at different times, with the maximum time gap being approximately 4 yr, the red dashed lines mark this boundary.
Other Images in This Article
Copyright and Terms & Conditions
© 2026. The Author(s). Published by the American Astronomical Society.