Image Details
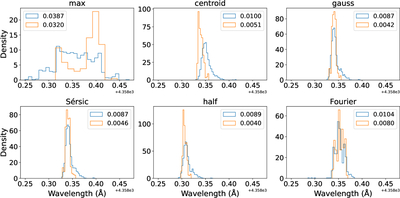
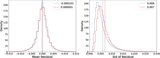
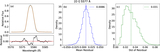
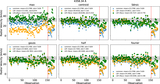
Caption: Figure 8.
Distributions of the centers of both the original (blue) and neural network predicted (orange) line profiles determined by the above six definitions, as indicated by the titles of each panel. The profiles used here are the emission lines with the central wavelength of 4358.34 Å imaged by the first fiber of Spectrograph No. 1 in 2017. The numerical values in the figure represent the standard deviations of the distributions.
Other Images in This Article
Copyright and Terms & Conditions
© 2026. The Author(s). Published by the American Astronomical Society.
Copyright ©
2026 Astronomy Image Explorer. All Rights Reserved.