Image Details
Caption: Figure 7.
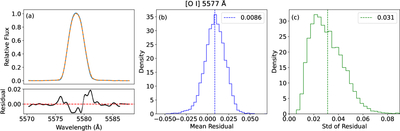
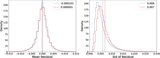
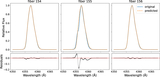
Panel (a) shows one example of the recovered [O I] 5577 Å line profile using our IP model. Panels (b) and (c) show the distributions of ﹩{{\rm{mean}}}_{{\rm{res}}}﹩ and ﹩{\sigma }_{{\rm{res}}}﹩ for all [O I] lines from the year of 2024, respectively. The dashed lines denote the mean value.
Other Images in This Article
Copyright and Terms & Conditions
© 2026. The Author(s). Published by the American Astronomical Society.
Copyright ©
2026 Astronomy Image Explorer. All Rights Reserved.