Image Details
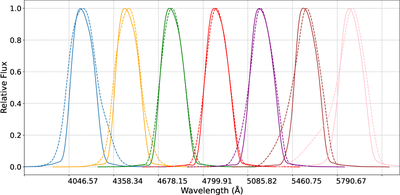
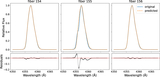
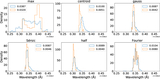
Caption: Figure 10.
The predicted IPs on two dates. From left to right, the IPs correspond to central wavelengths of 4046.57, 4358.34, 4678.15, 4799.91, 5085.82, 5460.75, and 5790.67 Å. Solid lines indicate profiles from an exposure on the left side of the red dashed line in Figure 9, while dashed lines correspond to ones on the right side.
Other Images in This Article
Copyright and Terms & Conditions
© 2026. The Author(s). Published by the American Astronomical Society.
Copyright ©
2026 Astronomy Image Explorer. All Rights Reserved.