Image Details
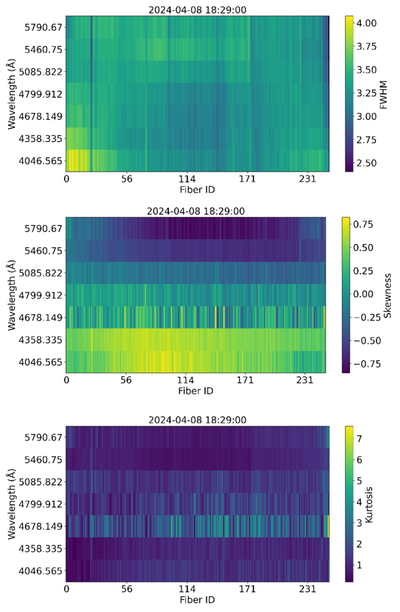
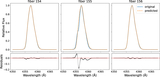
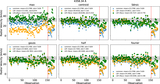
Caption: Figure 1.
This figure shows the variation of the lamp line profile parameters for LAMOST Spectrograph No. 1 at a given time (indicated in the title of each panel). From top to bottom, the panels show 2D maps of the FWHM, skewness, and kurtosis of the profiles, with fiber ID on the x-axis and wavelength on the y-axis.
Other Images in This Article
Copyright and Terms & Conditions
© 2026. The Author(s). Published by the American Astronomical Society.
Copyright ©
2026 Astronomy Image Explorer. All Rights Reserved.