Image Details
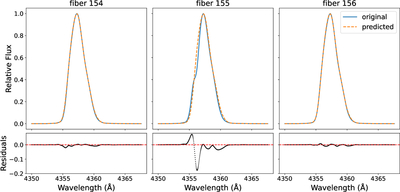
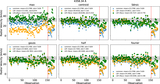
Caption: Figure 5.
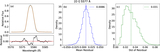
Comparison between the original and neural network predicted IP for three adjacent fibers (fiber 154–156). The top panels show the normalized flux profiles, where the blue lines represent the original IP and the orange dashed lines show the predicted IP. The bottom panels show the residuals (original—predicted), with the red dashed lines indicating zero. The middle panel (fiber 155) exhibits significantly larger residuals compared to its neighbors, suggesting a possible abrupt change in the IP shape for that fiber. This deviation likely explains the relatively poor fitting performance for fiber 155.
Other Images in This Article
Copyright and Terms & Conditions
© 2026. The Author(s). Published by the American Astronomical Society.
Copyright ©
2026 Astronomy Image Explorer. All Rights Reserved.