Image Details
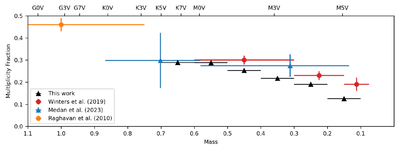
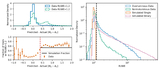
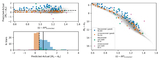
Caption: Figure 16.
Comparison between our multiplicity fraction and other work. In black are the total multiplicity fractions for each mass bin. Included in the plot are multiplicity fractions from J. G. Winters et al. (2019; in red), D. Raghavan et al. (2010; in orange), and I. Medan & S. Lépine (2023; in blue). Points represented as dots are measured values, whereas upward arrows represent lower limits. The horizontal bars represent the width of the bins and not an error.
Other Images in This Article
Show More
Copyright and Terms & Conditions
© 2026. The Author(s). Published by the American Astronomical Society.
Copyright ©
2026 Astronomy Image Explorer. All Rights Reserved.