Image Details
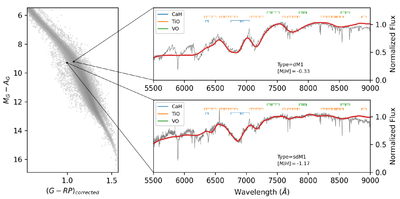
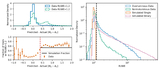
Caption: Figure 1.
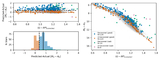
The strong relationship between the optical photometry and spectra for low-mass stars. Left panel: dereddened, Gaia CMD for our stellar sample defined in Section 2. Two examples, a metal-rich dwarf (PM J08202+0532) and a metal-poor subdwarf (G 192-52), are pulled from this distribution. Right panels: low-resolution XP spectrum (red) and medium-resolution LAMOST DR9 (gray) spectra for these examples. Their location on the CMD is shown, and arrows point to their spectra in the right panels. Labels above the spectra identify the strongest molecular features in the SED, showing that there are drastic changes for different metallicities. This change is strong enough to affect the photometry.
Other Images in This Article
Show More
Copyright and Terms & Conditions
© 2026. The Author(s). Published by the American Astronomical Society.