Image Details
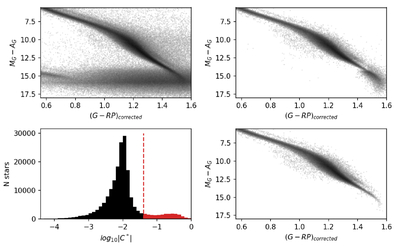
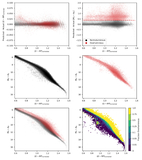
Caption: Figure 3.
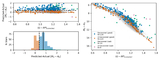
Winnowing from all stars within 100 pc to the Regression Sample in four parts. Top left: CMD of all low-mass stars in Gaia with a parallax ϖ > 10 mas. Top right: resulting sample given our ADQL query described in Section 2. It can be seen that there are still issues with the photometry, especially in the lowest-mass stars. Bottom left: distribution of the corrected PHOT_BP_RP_EXCESS_FACTOR, which we represent as C* (M. Riello et al. 2018). The red line at log10∣C*∣ = –1.4 represents our cut for stars with poor photometry. Bottom right: Gaia CMD with the high C* sources removed, representing the final Regression Sample of 127,843 stars.
Other Images in This Article
Show More
Copyright and Terms & Conditions
© 2026. The Author(s). Published by the American Astronomical Society.