Image Details
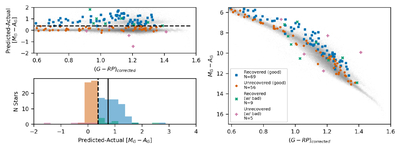
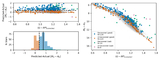
Caption: Figure 8.
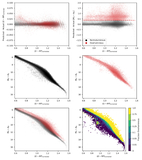
The AAVSO VSX eclipsing binary catalog is shown in four sets based on whether 1) they were recovered as overluminous via our method or 2) they have good photometric, spectroscopic, and astrometric data as defined in Section 2. Data that pass our quality test are split into the recovered set (blue) and the unrecovered set (orange). The stars that do not pass are also split into recovered (green) and unrecovered (pink) sets. The top left panel shows the overluminosity as a function of color, with the dashed line displaying our overluminous limit. The bottom left panel displays the different samples’ overluminosity as histograms with our overluminosity limit shown as a dashed line. The solid line represents the magnitude offset for an exactly equal-mass binary. The right panel shows the dereddened Gaia CMD of the systems plotted over the full 100 pc sample in gray.
Other Images in This Article
Show More
Copyright and Terms & Conditions
© 2026. The Author(s). Published by the American Astronomical Society.