Image Details
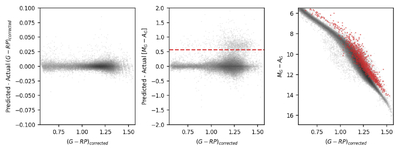
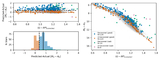
Caption: Figure 4.
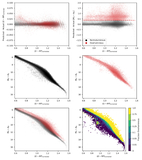
Comparison between the predictions from our first HISTGRADIENTBOOSTINGREGRESSOR model and the measured values from Gaia. Left panel: precision of the predicted color compared to the measured values. The low scatter shows that we recover this feature well. Middle panel: precision of the absolute magnitude prediction. Unlike the color, there is a cloud of stars hovering above the central distribution. These systems have a lower absolute magnitude and are therefore brighter than their prediction: overluminous binary systems. We identify these systems with the dashed red line, which lies at three standard deviations above zero. Right panel: Overluminous sources are highlighted in red on a Gaia CMD.
Other Images in This Article
Show More
Copyright and Terms & Conditions
© 2026. The Author(s). Published by the American Astronomical Society.