Image Details
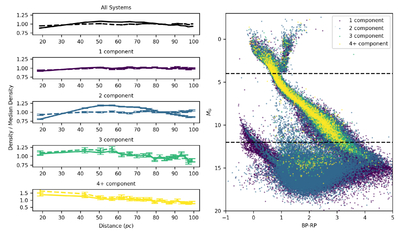
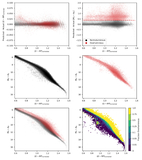
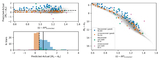
Caption: Figure 14.
Density of the Catalog of Systems and its Gaia CMD. Left panel: density normalized by its median for bins of equal volume. The density for all systems is shown in the top panel and then split into the number of components in the lower panels. The solid lines mark the normalized density for all systems that have each number of components, while the dashed lines show the normalized density only for sources with absolute magnitude between 4 and 12 (shown as black dashed lines in the right panel). Right panel: Gaia CMD of the primary component of each of these systems. Points are colored by the number of components in each system. There are many systems that lie between the main sequence and white dwarf sequence, which are a set of known spurious sources. We elect not to remove these sources from the catalog so that a user can produce their own cut.
Other Images in This Article
Show More
Copyright and Terms & Conditions
© 2026. The Author(s). Published by the American Astronomical Society.