Image Details
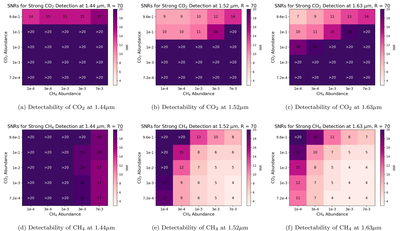
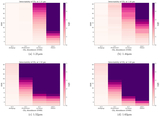
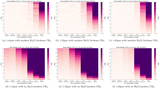
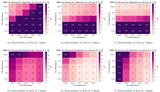
Caption: Figure 8.
Top: required SNR for a strong CO2 detection at 1.44 μm (a), 1.52 μm (b), and 1.63 μm (c). Bottom: required SNR for a strong CH4 detection at 1.44 μm (d), 1.52 μm (e), and 1.63 μm (f). For each CO2–CH4 combination, the necessary SNR required for a strong detection is shown, where darker colors correlate to higher SNRs and lighter colors correlate to lower SNRs. CH4 abundances are plotted on the x-axis, and CO2 abundances are plotted on the y-axis. CH4 and CO2 abundances are taken from Table 4.
Other Images in This Article
Copyright and Terms & Conditions
© 2026. The Author(s). Published by the American Astronomical Society.
Copyright ©
2026 Astronomy Image Explorer. All Rights Reserved.