Image Details
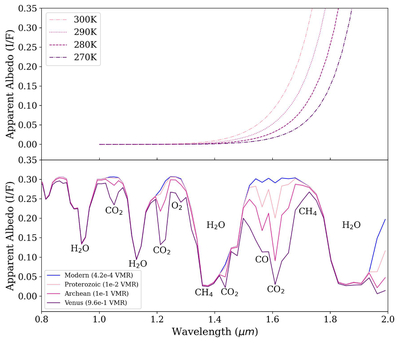
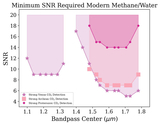
Caption: Figure 1.
Illustrates the balancing act of keeping thermal noise minimal while maximizing the detectability of spectral features like CO2 and CO. The top plot shows the relative noise based on varying telescope temperature between 0.8 and 2.0 μm. The bottom plot shows spectral features from 0.8 to 2.0 μm of H2O, CH4, O2, CO, and CO2. We plot a modern-Earth spectra using the Planetary Spectrum Generator (PSG) with four varying CO2 abundances: Modern (4.2 × 10⁻⁴ VMR) in dark blue, Proterozoic-like (1 × 10⁻² VMR) in light pink, Archean-like (1 × 10⁻¹ VMR) in magenta, and Venus-like (9.6 × 10⁻¹ VMR) in purple. The figure plots wavelength (μm) on the x-axis and apparent albedo (I/F) on the y-axis.
Other Images in This Article
Copyright and Terms & Conditions
© 2026. The Author(s). Published by the American Astronomical Society.