Image Details
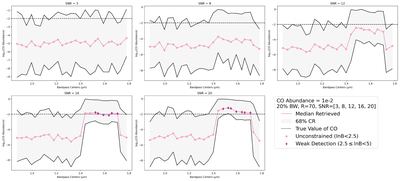
Caption: Figure 3.
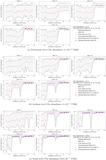
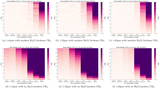
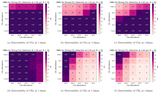
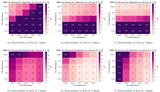
Strength of CO detections at SNRs of 3, 8, 12, 16, and 20 with the highest CO abundance, 1 × 10⁻² VMR, throughout the wavelength range of 0.8–2.0 μm. Light pink circles portray unconstrained detections, magenta diamonds portray weak detections, and there are no strong detections. lnB classification follows the values in Table 2. The 68% credible region is shaded in gray. The true value of the CO abundance is marked by the horizontal dashed black line.
Other Images in This Article
Copyright and Terms & Conditions
© 2026. The Author(s). Published by the American Astronomical Society.
Copyright ©
2026 Astronomy Image Explorer. All Rights Reserved.