Image Details
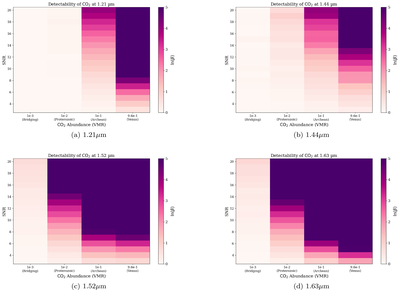
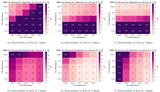
Caption: Figure 4.
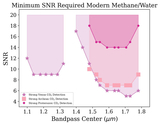
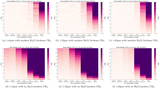
Strength of CO2 detections at (a) 1.21 μm, (b) 1.44 μm, (c) 1.52 μm, and (d) 1.63 μm with respect to CO2 abundance and SNR assuming a 20% bandpass. Columns on the x-axis are different CO2 abundances: Bridging, Proterozoic-like, Archean-like, and Venus-like, from left to right. SNR values are on the y-axis. The strength of detection is shown for each combination of CO2 abundance and SNR. As indicated by the color bar on the right side of each heat map, the darker the purple is, the stronger the detection is, and the lighter the pink is, the more unconstrained the detection is, following the same lnB classifications defined in Table 2.
Other Images in This Article
Copyright and Terms & Conditions
© 2026. The Author(s). Published by the American Astronomical Society.