Image Details
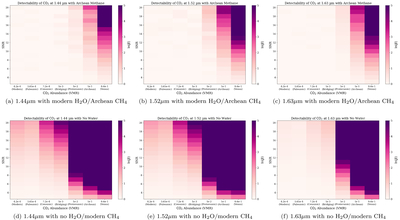
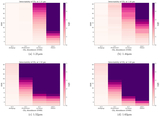
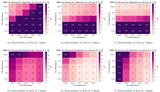
Caption: Figure 7.
Varying detection strength of CO2 with respect to CO2 abundance (on the x-axis) and SNR (on the y-axis) at bandpass centers of 1.44 μm (a and d), 1.52 μm (b and e), and 1.63 μm (c and f). For each abundance and SNR, the color corresponds to the strength of the CO2 detection; the darker the purple, the stronger the detection, and the lighter the pink, the more unconstrained the detection. The top plots (a, b, and c) show CO2 detection strength for modern H2O and Archean CH4. The bottom plots (d, e, and f) show CO2 detection strength for no H2O and modern CH4.
Other Images in This Article
Copyright and Terms & Conditions
© 2026. The Author(s). Published by the American Astronomical Society.
Copyright ©
2026 Astronomy Image Explorer. All Rights Reserved.