Image Details
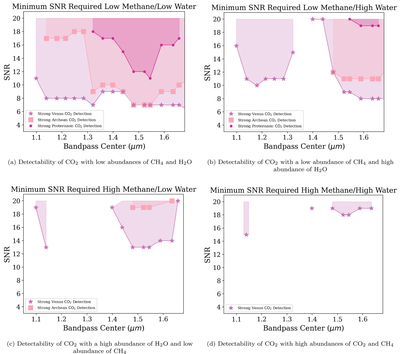
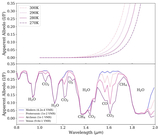
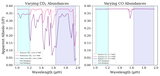
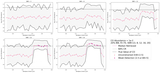
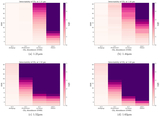
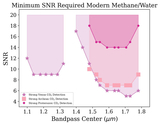
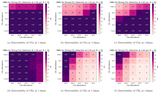
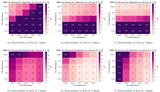
Caption: Figure 10.
Minimum SNR required to achieve a strong CO2 detection at each bandpass center for four varying planetary archetypes: (a) low CH4 and low H2O, (b) low CH4 and high H2O, (c) high CH4 and low H2O, and (d) high CH4 and high H2O. The bandpass center is plotted on the x-axis, spanning 1.05–1.68 μm, and the SNR is plotted on the y-axis. Varying abundances are plotted in different colors and shapes: Venus-like in light purple stars, Archean-like in light pink squares, and Proterozoic-like in dark pink circles. The relative shading corresponds to any area CO2 is strongly detected and matches colors with the respective CO2 abundance.
Other Images in This Article
Copyright and Terms & Conditions
© 2026. The Author(s). Published by the American Astronomical Society.