Image Details
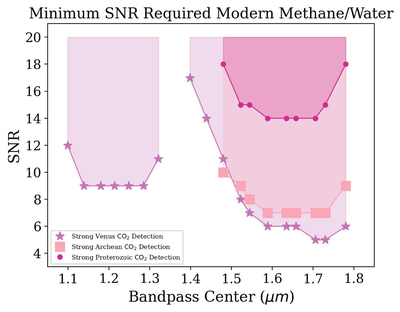
Caption: Figure 5.
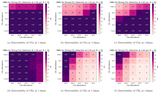
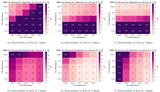
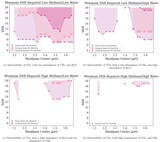
Minimum SNR required for a strong CO2 detection at each bandpass center for the three highest CO2 abundances that achieve strong detections. Venus-like is plotted in purple stars, Archean-like is plotted in light pink squares, and Proterozoic-like is plotted in magenta circles. The shaded regions represent the spaces in which you could achieve a strong detection for each abundance in their respective colors. The x-axis is bandpass center (μm) and the y-axis is SNR.
Other Images in This Article
Copyright and Terms & Conditions
© 2026. The Author(s). Published by the American Astronomical Society.
Copyright ©
2026 Astronomy Image Explorer. All Rights Reserved.