Image Details
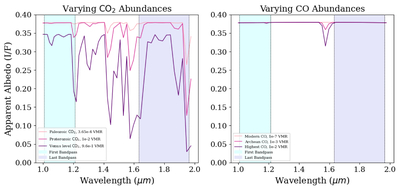
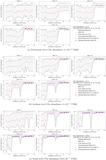
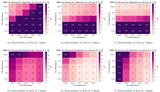
Caption: Figure 2.
CO2 and CO spectral features at varying abundances from 0.8 to 2.0 μm. It plots wavelength ( μm) on the x-axis and apparent albedo (I/F) on the y-axis. We plot three CO2 abundances from Table 3: Paleozoic-like (3.65 × 10⁻⁴ VMR) in light pink, Proterozoic-like (1 × 10⁻² VMR) in magenta, and a Venus-like (9.6 × 10⁻¹ VMR) in purple. We plot three CO abundances: Modern (1 × 10⁻⁷ VMR; Center for Science Education (2017)) in light pink, Archean-like (1 × 10⁻³ VMR; D. C. Catling & K. J. Zahnle (2020)) in magenta, and the highest abundance (1 × 10⁻² VMR, which is a filler abundance) in purple. The first and last bandpasses are shaded in light blue and light purple, respectively.
Other Images in This Article
Copyright and Terms & Conditions
© 2026. The Author(s). Published by the American Astronomical Society.