Image Details
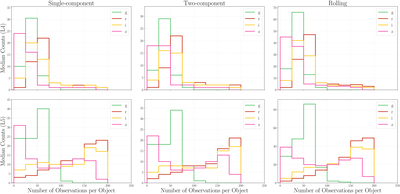
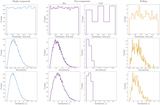
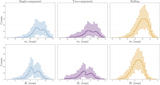
Caption: Figure 9.
Histograms of the number of detections per object, broken down per filter for the three input models (columns) and by Lagrange cloud (L4, top row; L5, bottom row). All exclude any observations that fall within a DDF.
Other Images in This Article
Copyright and Terms & Conditions
© 2026. The Author(s). Published by the American Astronomical Society.
Copyright ©
2026 Astronomy Image Explorer. All Rights Reserved.