Image Details
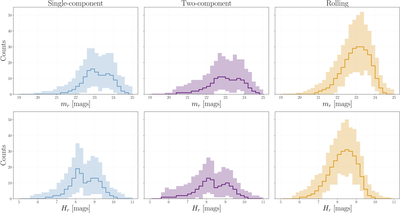
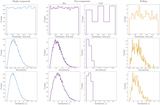
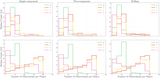
Caption: Figure 8.
Final 10 yr differential histograms of (top row) the median apparent magnitude distribution in the r band at the time of linkage of detected NTs for the three input models, and (bottom row) the median absolute magnitude in the r band of all detected NTs. The shaded region in each panel represents the uncertainty on all 103 simulations.
Other Images in This Article
Copyright and Terms & Conditions
© 2026. The Author(s). Published by the American Astronomical Society.
Copyright ©
2026 Astronomy Image Explorer. All Rights Reserved.