Image Details
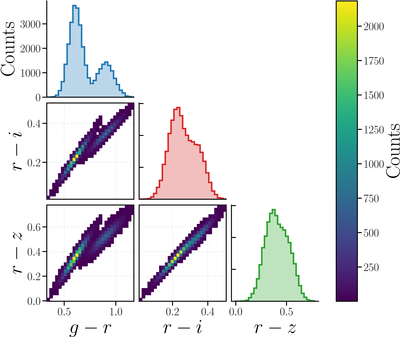
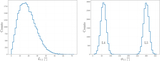
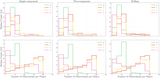
Caption: Figure 3.
g − r, r − i, and r − z color histograms for the input model produced from GMM parameters in Table 1. The leading diagonal represents the individual 1D histograms of each color, while the middle-left, bottom-left, and bottom-middle 2D histograms highlight their correlation. Samples are drawn to ensure this correlation is kept.
Other Images in This Article
Copyright and Terms & Conditions
© 2026. The Author(s). Published by the American Astronomical Society.
Copyright ©
2026 Astronomy Image Explorer. All Rights Reserved.