Image Details
Caption: Figure 1.
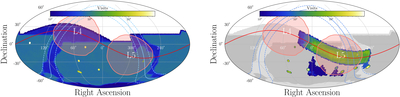
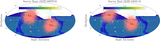
Sky maps of the number of visits across all filters of (left) the 10 yr LSST survey cadence based on the one-snap v4.3.1 simulation (SCOC 2024) and (right) the Science Validation survey based on the lsstcam_20250930 simulation (C. Claver et al. 2025; NSF-DOE Vera C. Rubin Observatory 2025); note the difference in color scale between the two. The main wide-fast-deep survey makes up ∼80% of the total main LSST survey time, receiving on average ∼800 visits per pointing. Also of note are the Northern Ecliptic Spur mini-survey (dark blue region, +10° ecliptic latitude) and the Deep Drilling Fields (yellow-white circles, regions with high temporal sampling cadence). For full details of the survey strategy, see SCOC (2024). Overplotted on both in solid red is the ecliptic plane. In solid blue is the Galactic plane, with the corresponding dashed cyan lines representing ±10°. On top of all of this in pink are the positions of both L4 and L5 clouds at the beginning of the survey for context.
Other Images in This Article
Copyright and Terms & Conditions
© 2026. The Author(s). Published by the American Astronomical Society.