Image Details
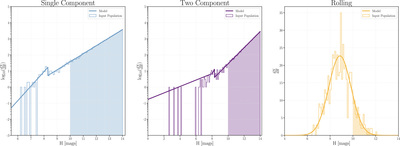
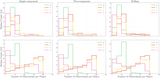
Caption: Figure 2.
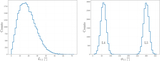
Differential histograms of all three absolute magnitude H distributions used in modeling the NT population in this work. In all cases, the solid line represents the analytical model for the distribution, while the histograms are the uniformly sampled NNT objects from that model. The shaded regions in all cases represent the region beyond the LSST’s nominal single-visit detection threshold (Hr ≈ 10) for an object at Neptune’s orbit. Represented here are (left panel) the single-component model, (middle) the two-component model, and (right) the rolling power-law model. Note that the single- and two-component models have a logarithmic y-axis scale, while the rolling power-law model is linear.
Other Images in This Article
Copyright and Terms & Conditions
© 2026. The Author(s). Published by the American Astronomical Society.