Image Details
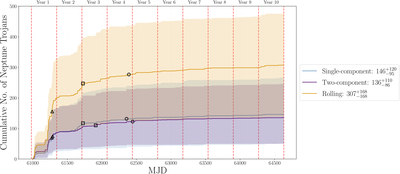
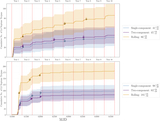
Caption: Figure C1.
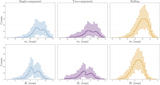
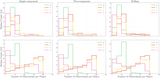
Cumulative histogram (with a bin size of one day) of the discovery rates over the 10 yr LSST lifetime for the single-component (blue), two-component (purple), and rolling power-law (orange) models. The points of 50% (open triangle) 80% (open square), and 90% (open circle) completion are shown for each model. Red dashed vertical lines represent survey year start/end points. The ranges here represent the upper and lower estimate for the scaling parameters used in each model, described in Section 2.3.1.
Other Images in This Article
Copyright and Terms & Conditions
© 2026. The Author(s). Published by the American Astronomical Society.
Copyright ©
2026 Astronomy Image Explorer. All Rights Reserved.